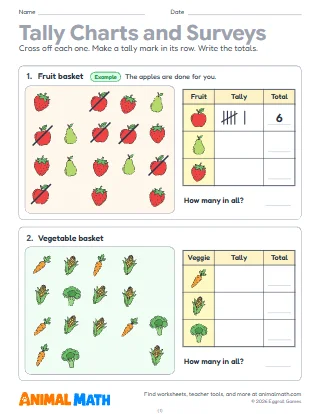
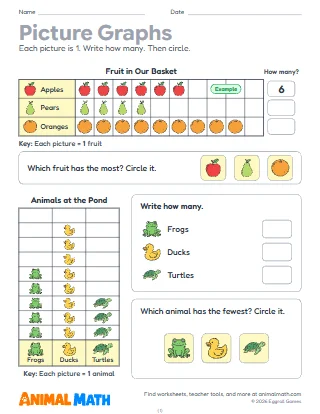
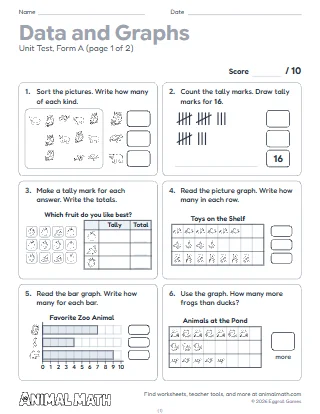
Five pages about gathering data, the first step before any graph. Page 1 is a toy bin of teddy bears, ducks, dinosaurs and beach balls: students cross off each toy, draw a dot for it in its row of the table and write how many, with the teddy bear row worked as an example, then circle the toy with the most and the one with the fewest. Page 2 asks how we could find out eight things: some, like how many windows are in our room, we can count; others, like which fruit our friends like best, we have to ask. Students circle Count or Ask. Page 3 is a class vote for a favorite fruit: each child shows a fruit in a speech bubble, and students check off each child, make a tally mark for each vote, write the numbers and check that the votes add up to the number of children. Page 4 records the weather on fifteen school days in a calendar with tally marks, then asks which weather happened on the most and the fewest days. On page 5 students run a survey of their own: ask 10 friends which pet they like best, tally the answers, circle the favorite and draw something in the classroom that could be counted.
Before page 1, dump a bin of real toys or blocks on the rug and sort them together, one pile for each kind. Read the questions on page 2 aloud and talk about why some can be answered by looking and others only by asking. For page 3, take a real class vote with hands up and tally it on the board as students watch. Page 5 works well as a walk-around activity: give students ten minutes to ask their classmates.
Sort the laundry, the toy box or a bag of snacks into kinds and count each pile. Keep a weather chart on the fridge for a week, one tally mark each morning. Help your child ask family members a question, such as which fruit they like best, and keep track with tally marks.
This pack supports the following Common Core State Standards for Mathematics:
© Copyright 2010. National Governors Association Center for Best Practices and Council of Chief State School Officers. All rights reserved.
Gathering data, the first step before any graph. Students sort and count a toy bin, decide whether to count or ask, tally a class vote and the weather, and run a survey of their own.
Tell us what to make next, or build your own with a worksheet maker.
This worksheet is free to download, print, copy, and hand out in your classroom or at home. You do not need to create an account, and there are no watermarks on the PDF.