Loading preview...

Skills Covered

  • Read and interpret data displays
  • Answer questions about data
  • Compare quantities in visual format
  • Develop data literacy skills
  • Practice counting and comparing
  • Build analytical thinking

How to Use This Worksheet

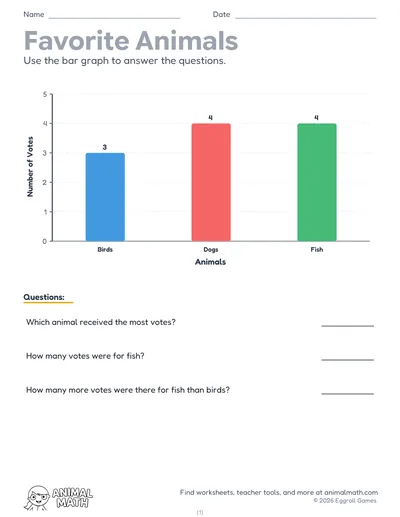
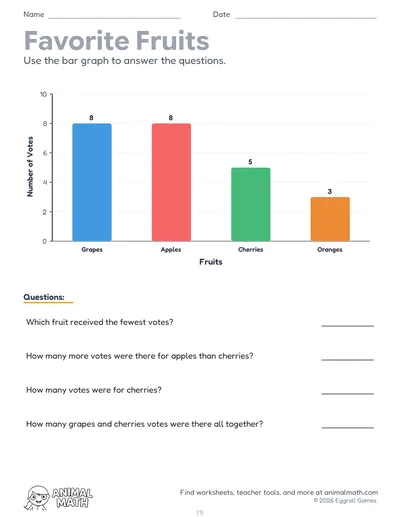
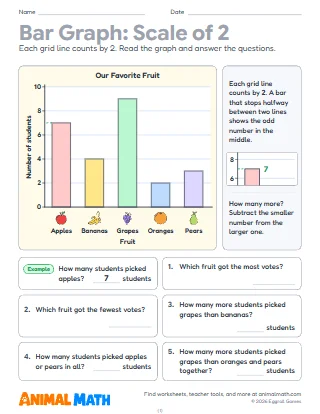
Read a horizontal bar graph and answer comparison questions. Values up to 10 with 4 categories.

Tips for Success

  • Ask students to explain their answers using the data
  • Encourage students to make up their own questions about the data
  • Connect data topics to real classroom surveys or interests
  • Use vocabulary like "most," "least," "more than," and "fewer than"

Common Core Standards Alignment

This worksheet supports the following Common Core State Standards for Mathematics:

  • 1.MD.C.4 Sort and show data in up to three groups, then answer questions about the total, each group's count, and how groups differ.
  • 2.MD.D.10 Make picture and bar graphs (one unit per square or picture) for up to four categories, and answer joining, separating and comparing questions from them.

© Copyright 2010. National Governors Association Center for Best Practices and Council of Chief State School Officers. All rights reserved.

Horizontal Bar Graph to 10

1st – 2nd Grade

Read a horizontal bar graph and answer comparison questions. Values up to 10 with 4 categories.

Download PDF
Pin
Want to customize? Open in our worksheet maker →

What’s Included

  • 5 worksheet pages
  • Answer keys included
  • Grade level: 1st - 2nd
  • Category: Data & Graphs
  • Print-ready PDF format
Can’t find what you need?

Tell us what to make next, or build your own with a worksheet maker.

Suggest a worksheet

Free to print and share

This worksheet is free to download, print, copy, and hand out in your classroom or at home. You do not need to create an account, and there are no watermarks on the PDF.